Much to the knowledge of my friends (and to the chagrin of my mother), I do fancy a good tennis bet every now and then. And this blog is going to unpack some of that.
Introduction
The gist is that I played tennis in college, I follow it pretty closely, and my college teammates and I text a lot about it.
So yes, now that I’m living in NYC, I’ve been known to occasionally throw down a fun tennis bet every now and then.
Honestly, I don’t bet a lot of size, it’s more just to have some skin in the game. I like parlays and it’s a good way to keep involved, and hey - every now and then, I win some money (and a lot of the time I lose some! (although I will say for specifically tennis betting, I am up overall)).
Here’s a fun one I just barely missed the other day ![]()
(By the way, the cover photo is Jannik Sinner’s epic win over Alcaraz at the Miami Open 2023 which I did actually bet on).

Anyway, the platform that I largely use to place bets is Draftkings, and that’s where this becomes interesting.
Goals
The technical and theoretical side around sports betting is pretty interesting. And that makes sense right? There’s a lot of money to be made in finance and trading, and sports markets are yet another well… market. And with that comes the normal factors (like arbitrage and positive expected value betting, which I’ll address in a later post).
However, this blog post is focusing around a simple idea:
Goal: I want to analyze all of the bets I’ve made in Draftkings. I want to visualize how I’m doing, look for statistical trends, and ideally come up with my true probability for a betting bucket so that I can use the Kelly Criterion.
The technical questions then became:
- What’s my winning betting percentage for tennis overall?
- How does that vary by the actual American odds placed?
- What’s my trend of tennis betting?
- Did I ever go on any hot streaks? Any cold streaks?
- Is there a certain tennis market where I do the best?
- Is it in the grand slams where markets might be tighter?
- Or alternatively in the challengers where perhaps the players are less well known?
Technology Used
- Javascript
- Python
- Features:
- Infrastructure:
If you’re curious about the code, you can get it here!
Background
Sports Betting Context
For a little bit more background, most sites use American Odds. Now, there’s basically a couple of different formats for betting:
- American odds
- Fractional odds
- Decimal odds
I’m not going to give a full rundown of all of those, and how to convert between, but basically, some examples:
- American odds
-
-150would mean you have to outlay$150to win$100 -
+150would mean you have to outlay$100to win$150 - Basically meaning negative American odds indicates favorable events
-
- Fractional odds
-
2 to 3would mean you have to outlay$300to win$200(note that this is the same as -150 American) -
3 to 2would mean you have to outlay$200to win$300
-
- Decimal odds
-
1.667would mean if you bet$150you’d win$100(or in other words if you bet 100, you’d get 1.667) -
2.500would mean if you bet$100you’d get$150(basically subtracting off the$100(or 1) that was bet)
-
I personally find decimal the most confusing, but it’s basically just normalized to $1.
Kelly Criterion
The Kelly Criterion is a formula for sizing a bet. It now has applications and use cases in finance and economics, but all I care about is sizing a bet.
I’m going to lean on the Wikipedia page (because this post might get long), but it can be summarized as such:
The Kelly bet size is found by maximizing the expected value of the logarithm of wealth, which is equivalent to maximizing the expected geometric growth rate.
And mathematically summarized as:
\[f^{*} = p - \frac{q}{b} = p - \frac{1-p}{b}\]where
\(f^*\) - fraction of bankroll to wager
\(p\) - probability of a win
\(b\) - proportion of bet gained with a win
Note, for American:
- If negative,
- If positive,
DraftKings
Draftkings is my method of poison. It basically all started when I was living in Chicago and unsurprisingly working at a trading company. A buddy who probably knows more about sports than anyone I’ve ever met was telling me about him betting on college basketball and how easy it was (to bet, not to win money). I’ll talk about Draftkings, but this is not a slander piece. I am positive most books use methods like below.
Technical Discussion
Part 1: Getting the Data
Draftkings Difficulties
Sports betting platforms (Draftkings, FanDuel, Caesars, etc, etc) don’t really like it when you get too quantitative or technical with them. And that’s unsurprising. They just want to offer basically a wider market to factor in some % that they take for people placing bets on either side (so that the betters basically always lose).
That’s why with this particular problem analyzing all your past bets should be trivial right? I’m sure you’re probably like:
Oh there should be some
Export to Excelbutton in Draftkings right?
And you’d be wrong!
Now… I don’t think they do this intentionally, but… I wouldn’t be surprised.
They’re basically trying to keep their bettors relatively in the dark, so that they don’t fine-tune their approach. Shitty move number #1 Draftkings ![]()
Approach A) Selenium + Beautiful Soup 


Ok so then I thought, well that’s no worries. I’ve used Selenium before to automate some UI testing, why don’t I just fire up a headless Chrome webdriver, login, use Beautiful Soup to parse the HTML, and then write out an Excel plugin.
That’s easy, no sweat. Python all the way, would probably take maybe 45 minutes?
![]()
![]()
![]() wrong again! Again - unsurprisingly - Draftkings probably doesn’t want this to happen. A super trivial extension would be to automate actual bets being placed (not super trivial given lots of other tough problems), and then Draftkings might post a bad market quote, and then get absolutely slammed against that.
wrong again! Again - unsurprisingly - Draftkings probably doesn’t want this to happen. A super trivial extension would be to automate actual bets being placed (not super trivial given lots of other tough problems), and then Draftkings might post a bad market quote, and then get absolutely slammed against that.
There were two actual issues here:
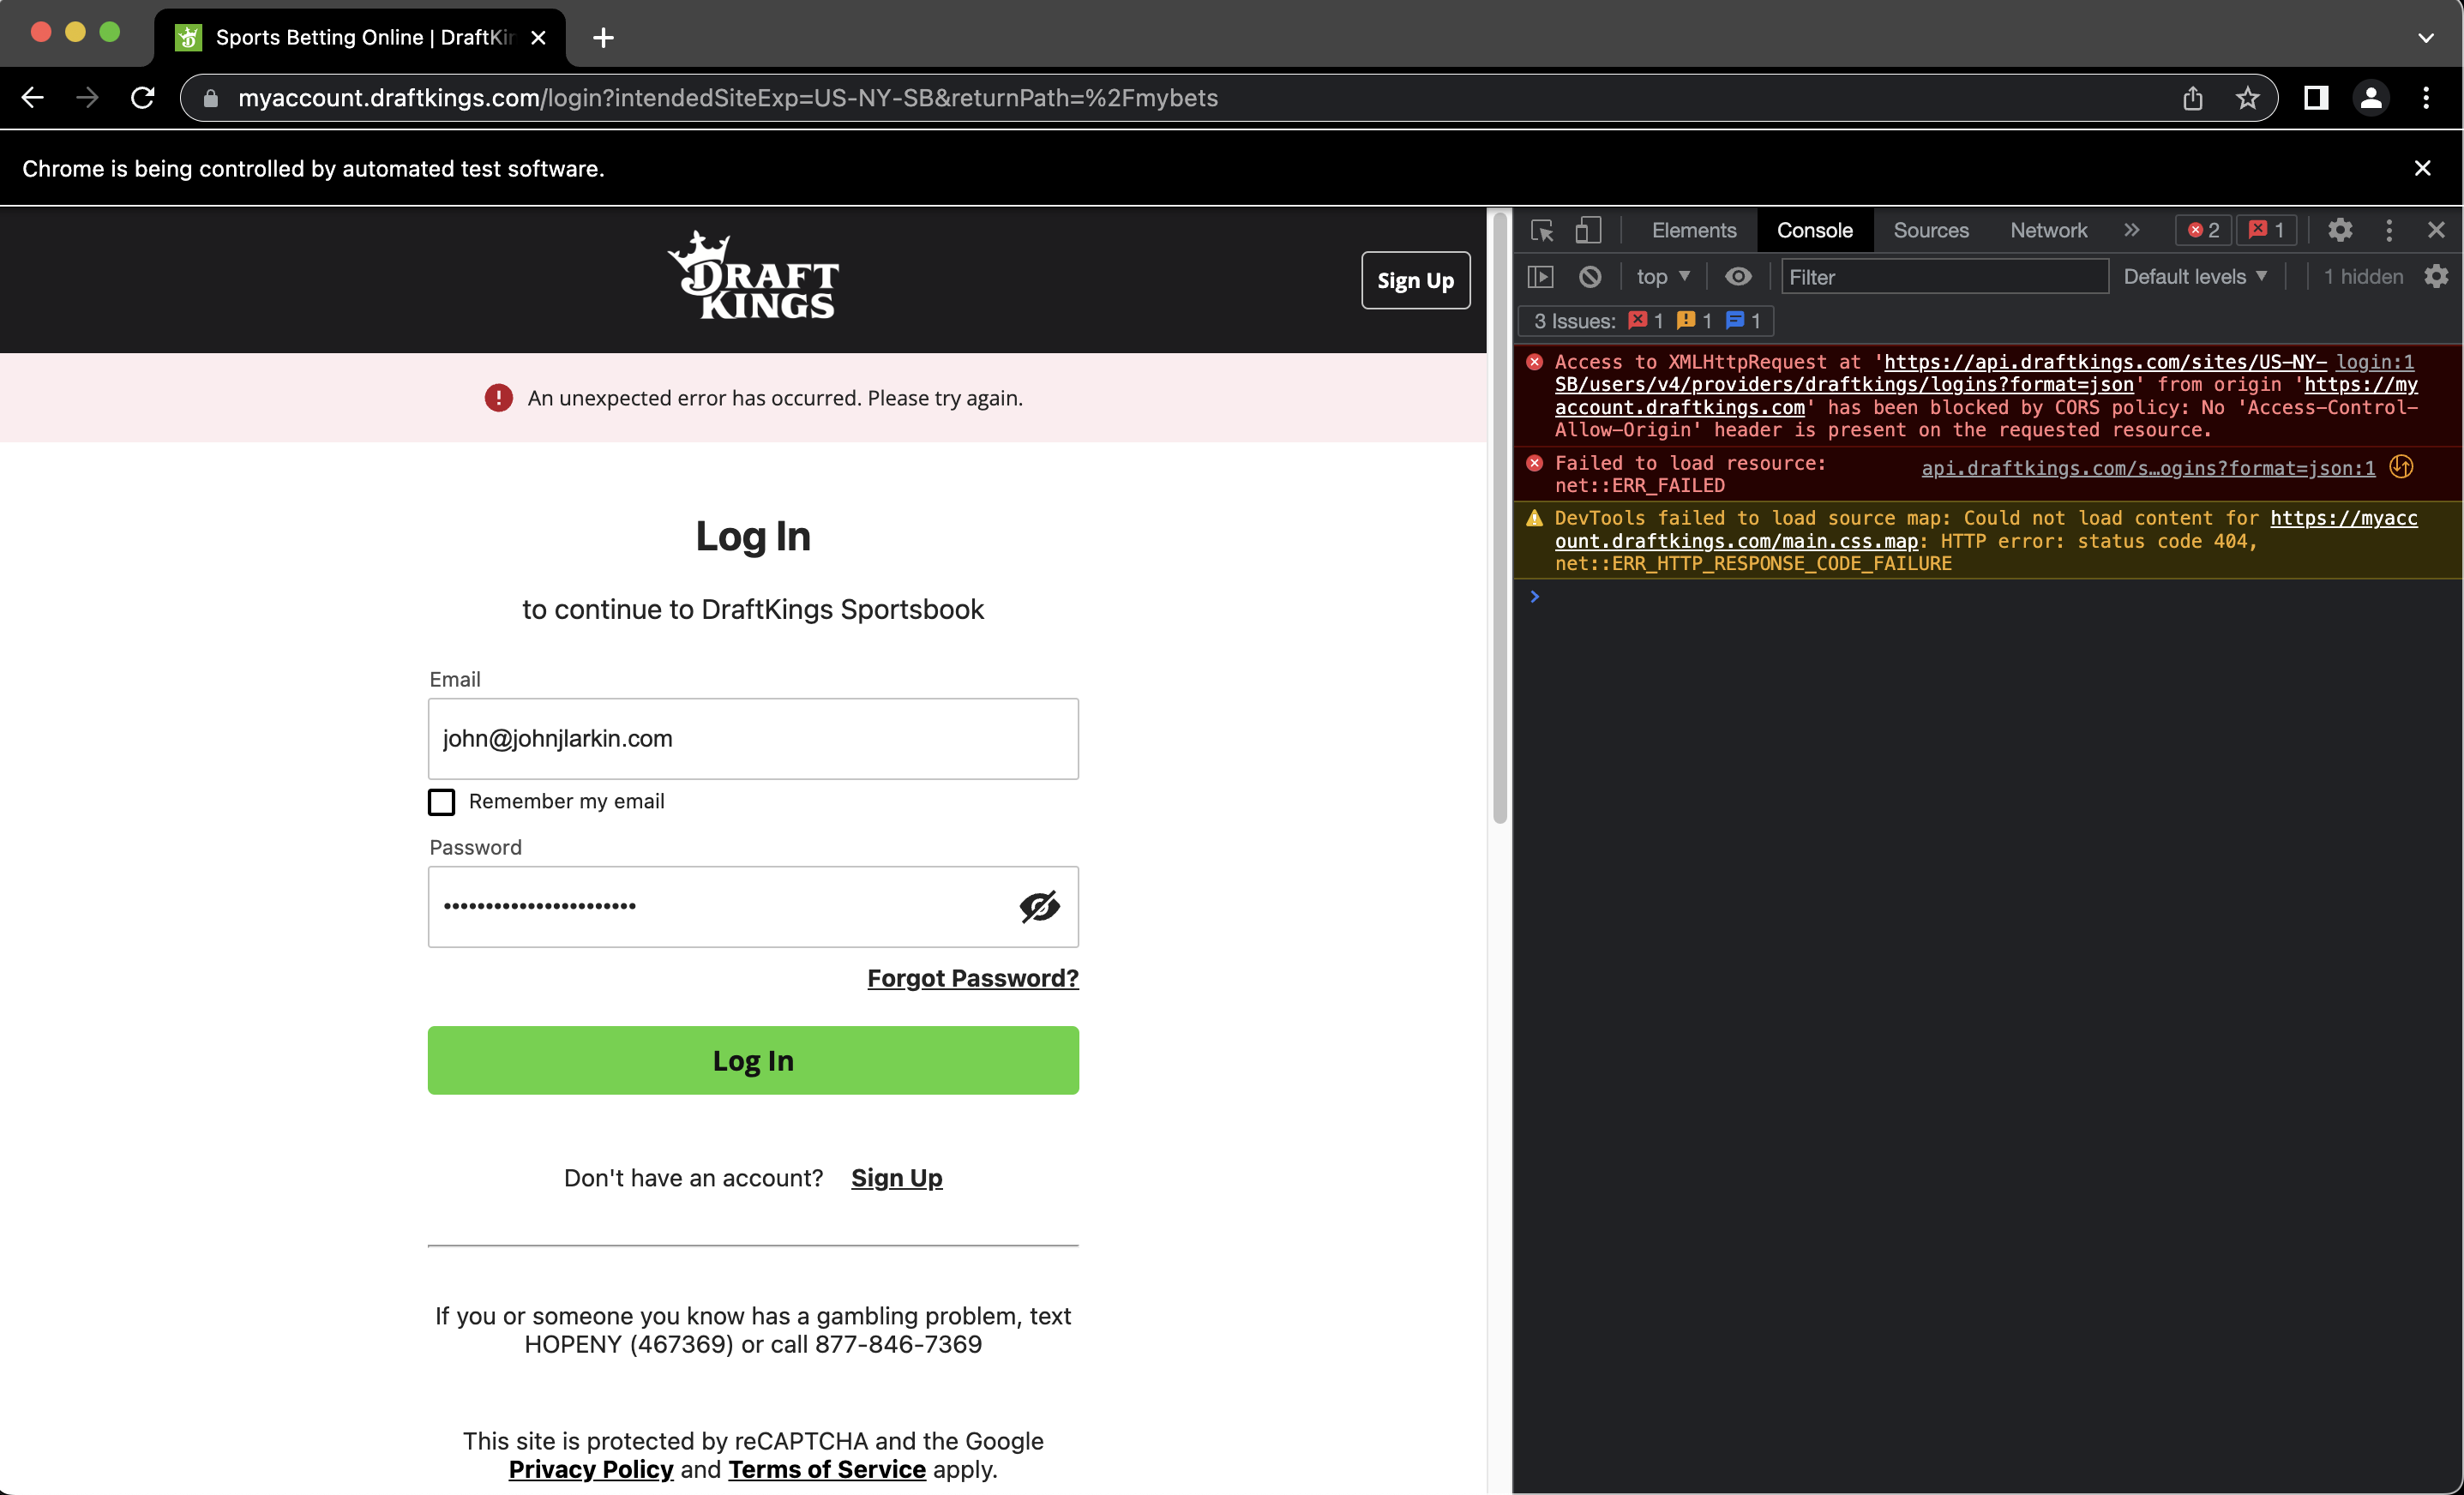
So the first issue I hit here was running into Draftkings standard protocol against CORS or Cross-Origin-Resource-Sharing.
The TLDR here is that CORS is a header passed into requests that indicate to the server if the server should allow origins (i.e. where the request is coming from) that is not from its own.
This comes up a lot in browser scripting because often a web application wants to ensure that the application that loaded the web page is the same origin making subsequent requests, rather than being driven from a Selenium script per say.
You can see the console message that was logged here:
So I thought alright maybe I could skirt around this using some of the selenium driver options. So basically adding these lines of code:
options = webdriver.ChromeOptions()
options.binary_location = "/Applications/Google Chrome.app/Contents/MacOS/Google Chrome"
options.add_argument("start-maximized")
options.add_argument("disable-web-security")
options.add_experimental_option("excludeSwitches", ["enable-automation"])
options.add_experimental_option('useAutomationExtension', False)
driver = webdriver.Chrome(options=options, service=Service(ChromeDriverManager().install()))
However ![]() still no dice. Draftkings is probably doing something a bit clever here, and I didn’t really want to dig in more detail.
still no dice. Draftkings is probably doing something a bit clever here, and I didn’t really want to dig in more detail.

So here’s basically where I got to:
Approach B) Download .html + Beautiful Soup 


Alright, so this was of course kind of annoying. But I figured, alright no big deal. I can legitimately see my bet history, so why don’t I just download that actual HTML and use BeautifulSoup to parse it and write to an Excel file.
Now this is bit more manual, so I didn’t really love this approach, because I want to be able to run my script whenever and it to do all of the lifting… However, I’m actually glad it didn’t work out because it forced me to end up writing a chrome extension.
So the issue here is that because Draftkings lazy loads their DOM elements, not all the data is immediately downloadable.
You can see this issue here:
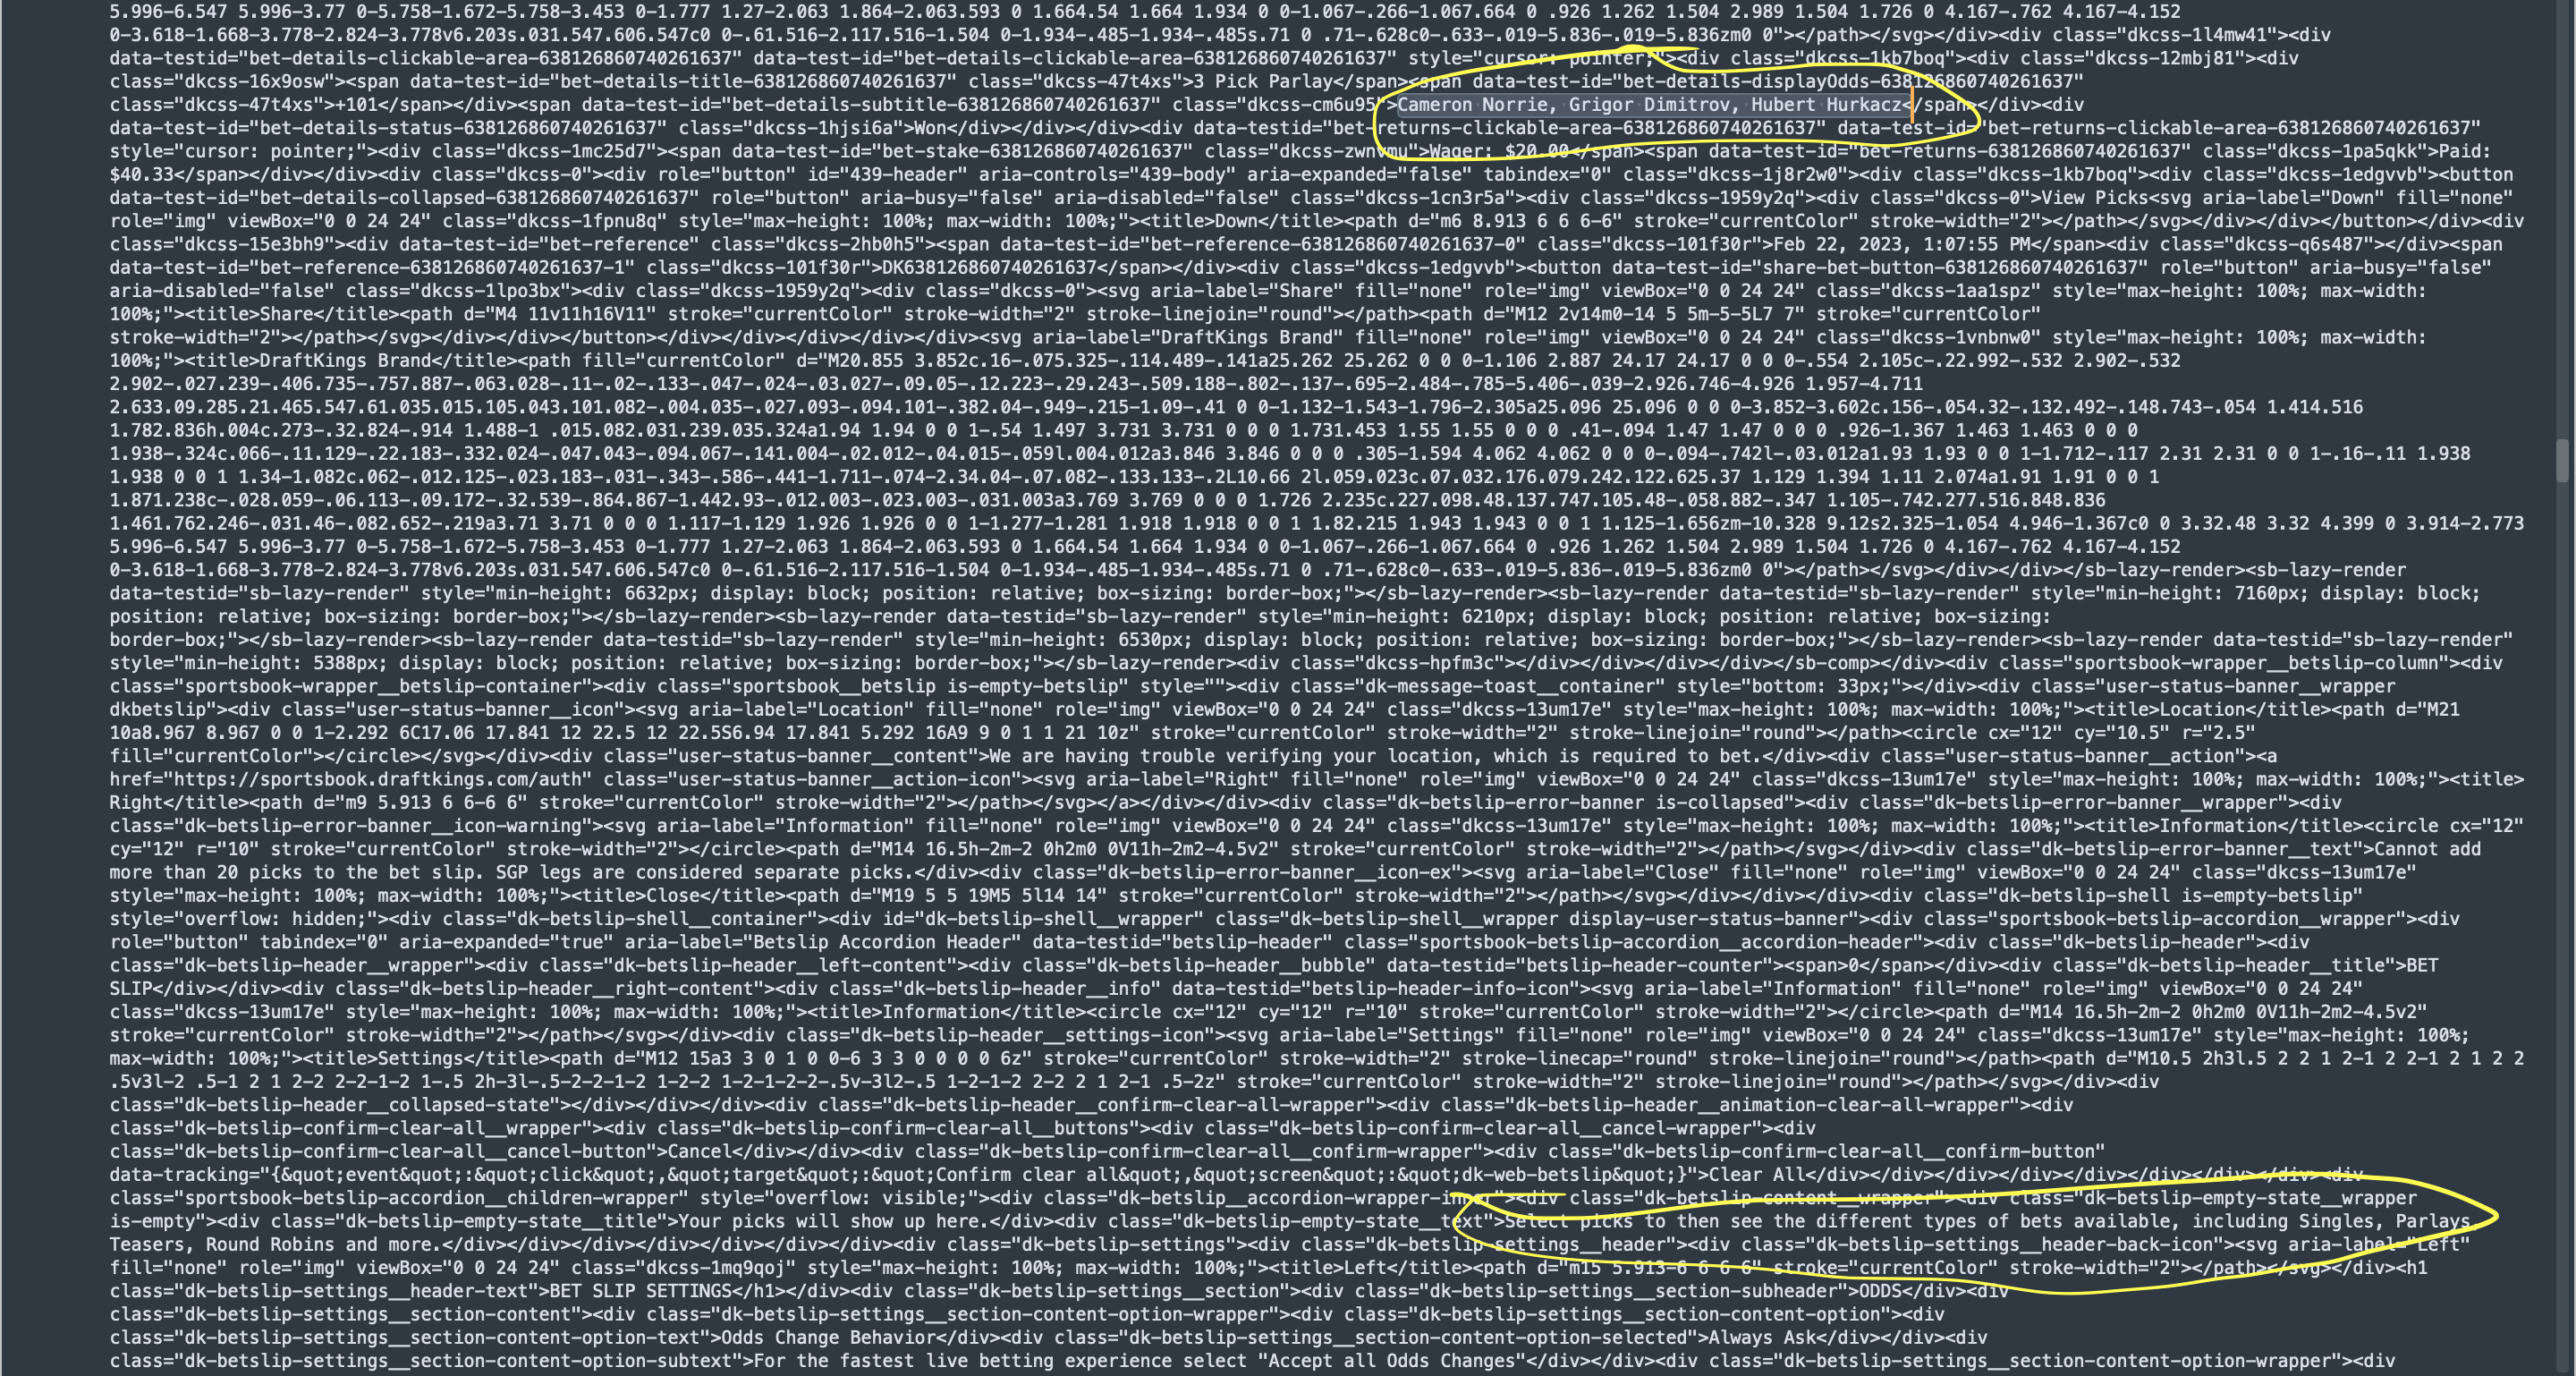
That is not the farthest back bet I made. So once again, I didn’t really love this approach and pivoted.
Approach B) Chrome Extension (winner) 


This turned out to be our winner! I had seen some Chrome extension that was present but you have to create some account with some random third party group and then it pushes the scraped data to that third party.
Obviously, this isn’t cool. I don’t want to really share this data and that Chrome extension (this one) doesn’t even work.
So that was lame, but I figured I’d always wanted to build my own, so I could see what was going on here. Let’s start with a demo of the finished product.
This was fun. I hadn’t written a Chrome extension before and I’m hoping publish this one soon (for free!).
Also I’m guessing Draftkings does this intentionally, but not all of the betting elements are loaded into the DOM initially. I presume they do this for two reasons 1) performance in terms of lazy loading web elements 2) also making it slightly more difficult to scrape their website (which they obviously don’t really want).
So you can see from the demo above that I basically automatically scroll to the bottom of the page (which goes back basically a full year if not more), to try and load all the elements into the DOM. It then just pages through each point and parses each bet made and writes that to a CSV. It uses the FileHandler that is native in Javascript through the window.showSaveFilePicker method. I also have to pepper in some sleep statements because on first draft, not everything was loaded into the DOM and so I was pulling empty rows / elements for partially loaded bets.
Part 2: Analyzing the Data
Ok so now that we have our chrome extension writing out to a CSV, I wanted to parse the data to generate some helpful graphs, so I could see how I was doing and potentially sharpen up my betting lines.
Let’s motivate with a demo:
This code is totally reproducible on your local machine. So feel free to run it there. It should be as simple as python bet_analyzer.py.
Once again, here’s the code!
Graphics
Here are some of the graphics it produces on analysis of my betting:
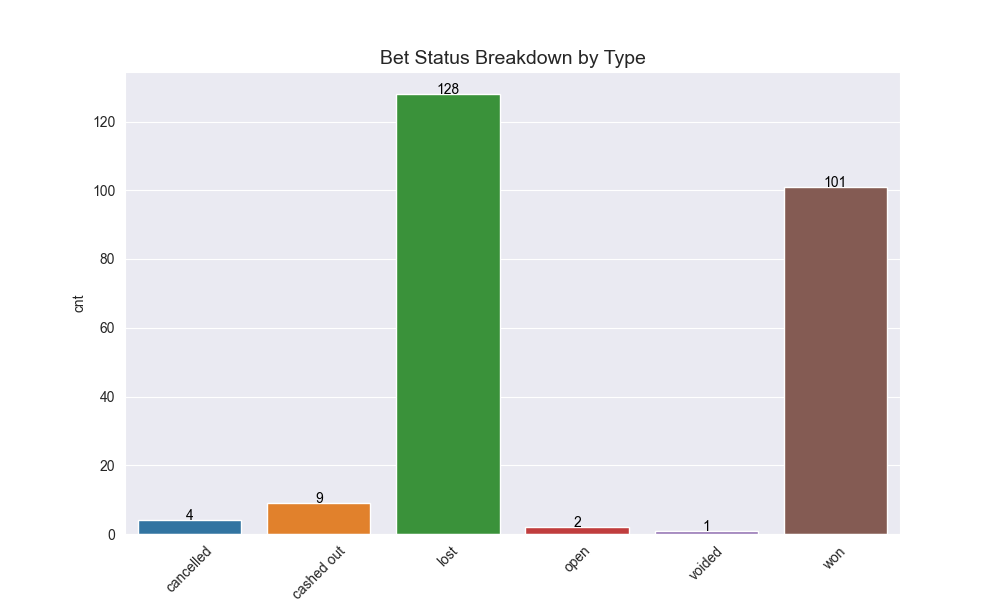


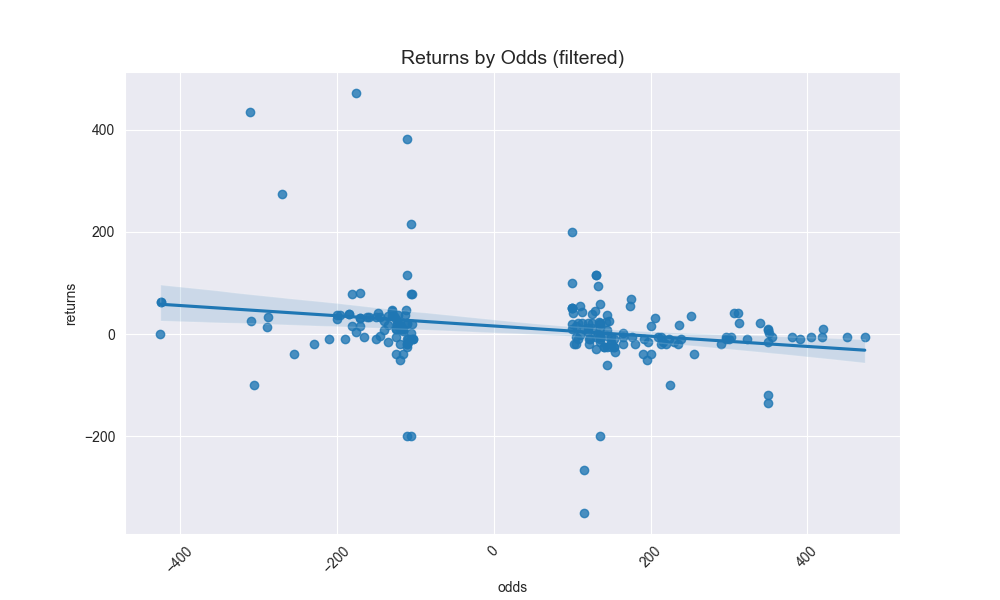
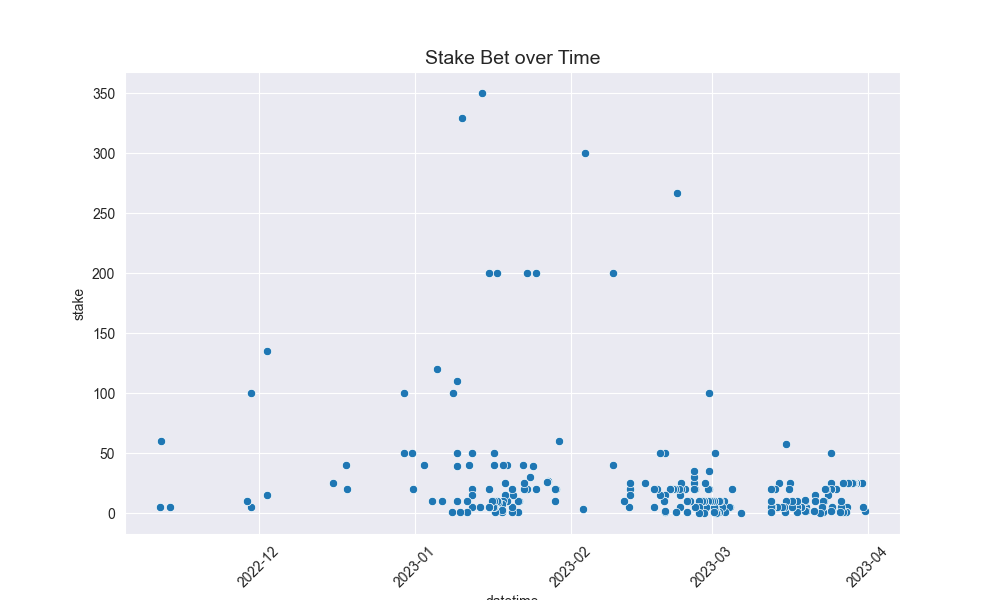
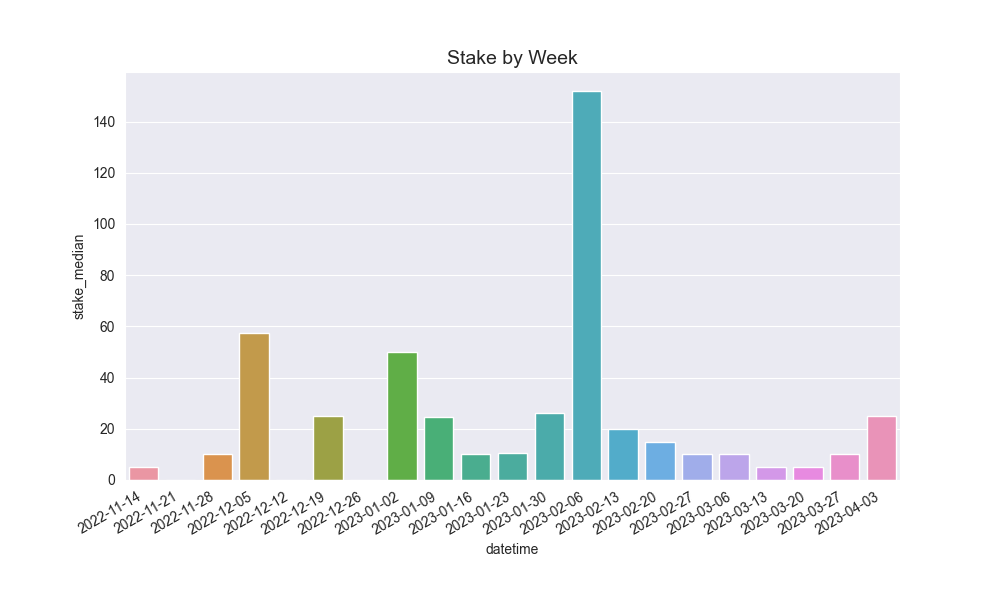
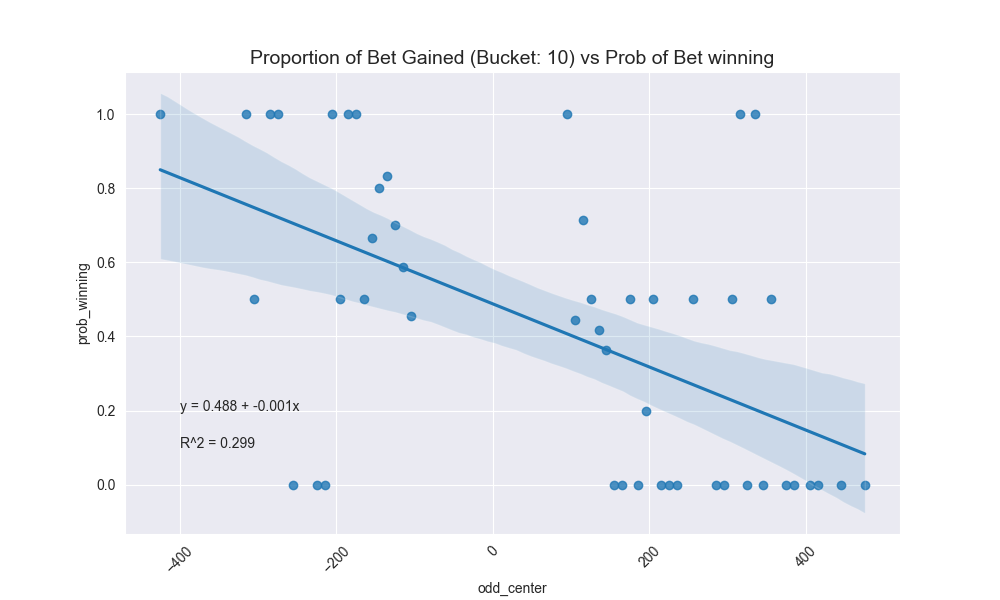
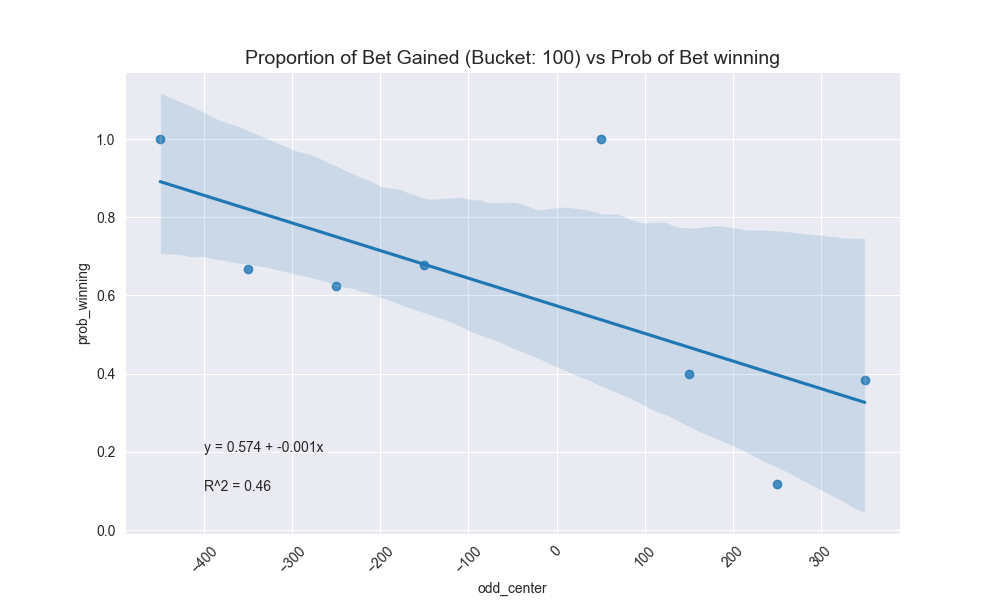
And then these are the core graphs that will help with predicting actually Kelly odds:

Technical Details
Again, what I mostly wanted to focus on was my tennis betting. Draftkings doesn’t really provide an easy way to indicate which sport the bet was for.
So my thinking was that I’d parse the top 200 ATP players from here: https://www.atptour.com/en/rankings/singles/?countryCode=all&rankRange=1-200 and infer if it was a parlay or the bet contained any details related to any of these players (largely by last name lookups). This code was relatively simple, basically contained here:
class DraftkingsReader:
    """This class is going to read, infer, aggregate, and allow access
    to core DataFrames to use for visualizations"""

    # pylint: disable=too-many-instance-attributes
    def __init__(self, filename: str) -> None:
        ...
        self._atp_player_details: list[PlayerDetails] = AtpScraper().get_top_players()

    ...

    def _detect_and_add_sport(self) -> None:
        ...
        transformed_df = self._core_dataframe
        last_names = set(player.last_name for player in self._atp_player_details)

        def any_tennis_indicators(row: dict) -> str:
            bet_title = row["title"]
            bet_title_tokens = bet_title.split(" ")
            if any(
                bet_title_token in last_names for bet_title_token in bet_title_tokens
            ):
                return str(Sports.TENNIS)
            return str(Sports.UNKNOWN)

        transformed_df["sport"] = transformed_df.apply(any_tennis_indicators, axis=1)
        return transformed_df
I then did some aggregation over both a 1 day interval, as well as a 7 day interval, as well as just some visualizations on the raw chart itself.
Part 3 - Kelly Criterion
The three bottom most graphs above were interesting to generate because the American odds I’ve actually bet are few and far between. So we had to do some type of aggregation or bucketing in order to produce a realistic estimation line so that we could predict what my actual implied betting correctness is for a group of odds.
I broke down my entire betting range (basically -500 to 500) into various buckets (10, 50, 100). 50 ended up making the most sense. I then calculated my percentage of bets for that bucket by the midpoint of the bucket range and graphed that. I fit a best fit line to it and observed the \(R^2\) coefficient. Once again, 50 as the bucketing criteria makes sense given it’s not too splayed, but also not absorbing too much noise.
The fact that the y-intercept is above 0.50 means that I have a slightly higher than average normalized betting rate, perhaps partially swayed by the fact that I have bet (and hit) more bets in the (-200, -100] range.
The resulting best fit line for predicting my actual probability given American odds from Draftking is this:
\[prob = 0.527 - 0.001 \cdot x\]That can then be used to give a true \(p\) value in the Kelly Criterion which I can then factor into my betting size.
An Example
So let’s say I have a bankroll of $500. And there’s a bet that I like sitting at -150 American odds. Here are the steps:
\[\begin{align*} f^{*} &= p - \frac{q}{b} = p - \frac{1-p}{b} \; (\text{Kelly Crit}) \\ b &= \frac{100}{\| -150 \|} \\ b &= .6667 \\ p &= 0.527 - 0.001 ({-150}) \\ p &= .677 \\ f^{*} &= .677 - \frac{1-.677}{.6667} \\ f^{*} &= 0.1925242238 \\ f &= 0.1925242238 \cdot 500 \\ f &= \$96 \\ \end{align*}\]I’ll caveat all of this with saying that .677 vs .6667 my calculated probability vs Draftkings market probability is verrrrry tight. When I picked this example, I didn’t realize it would be that tight. So that does make me a smidge nervous given this wasn’t the most rigorous process I’ve ever put together. But it’s an interesting example of the Kelly crit.
Another example. Bet I like at +200. Bankroll of $500.
\[\begin{align*} f^{*} &= p - \frac{q}{b} = p - \frac{1-p}{b} \\ b &= \frac{\| 200 \|}{100} \\ b &= 2 \\ p &= 0.527 - 0.001 ({200}) \\ p &= 0.327 \\ f^{*} &= 0.327 - \frac{1-0.327}{2} \\ f^{*} &= 0.327 - 0.3365 \\ f^{*} &= -0.0095 \\ \end{align*}\]In other words, I shouldn’t take this bet… That also makes sense given that if you look at the Returns by Odds - or the Odds Range Breakdown - you can see that I have missed the majority of bets in those buckets from (+100, +200] and (+200, +300].
Analysis Results
All in all? This is interesting!! And this was super fun to work on and learn more about. Distilling it all down, these are the core points I took away:
- I have lost more bets than I have won
- Perhaps not surprising given I love a small size, wild prop bet
- At the same time, I have earned more than I have lost
- Recently, I have a positive trend on odds vs time, meaning recently I have put on more small wild props than a year ago
- The
Odds Range Breakdownis about what I would expect. I’ve won 35/54 which is roughly 65% of those. -200 corresponds to 66% implied prob, and -100 corresponds to 50% implied prob, so I’m somewhat beating the book there. - I am going to try to utilize my Kelly Crit and calculated probs for better dynamic bet sizing
Conclusion
Betting is bad! And you should stay away from it. But that being said, it does provide a good opportunity for some fun data. I hope that you all have learned something and at least gotten to look at some somewhat aesthetically pleasing graphs. Please feel free to email with any questions or comments you might have!
